Blending the old with the new: Challenges and their solutions in teaching Business Analytics
The emergence of new disciplines within older, more established ones is a natural and inevitable part of academia; an exciting progression where new research and new thoughts are added to more mature thinking and pillars. Whilst this evolution is invigorating, when it comes to teaching new areas there are a suite of challenges to overcome which need careful consideration.
Business Analytics is a growing field, stemming from a range of other business-related topics. Because of its nascent nature, books focusing explicitly on it are only just emerging, and universities are only just beginning to truly focus on it as their own distinct area. With its second edition soon to publish, the author team of Business Analytics, Kevin Lertwachara and Leida Chen explored how they approached the hurdles they faced in teaching a new subject area and how they sought to overcome them.
Challenge: Materials don’t exactly reflect the needs of those using them
Any creation of content grapples with the challenge of being the right fit for its audience, but when the topic itself is one that’s relatively new, there’s even more at stake in ensuring alignment between the written words and the needs of those that will be using them.
The Business Analytics authors shared that, historically, they didn’t find content that was aligned to their teaching structure and approach. Admitting that it was often the case that material was borrowed or converted from Operations Management or Business Statistics courses, they said they were keen to build their own text that supported their own values and their own teaching of this new topic.
“This textbook was written from the ground up,” shared Kevin. “The chapters are devoted to topics totally aligned to how we’ve taught the course and are in line with the extensive feedback we undertook before starting work.” The pair explained that they had reached out to a range of companies and other university professors before beginning their writing and shared that that feedback shaped what the first edition of their book, Business Analytics, would feature and how it would be structured.
In addition to that, the author team explained that, frequently, texts looking at Business Analytics were limited in how it was presented, with the topic not being shown in a holistic way. Kevin and Leida explained that, in their experience, there was often too much of a focus on the modelling phase of the topic and not enough on the process in its entirety. The author team have blended key parts of the Business Analytics area, from data wrangling, storytelling and narrative through to the technical analysis, in their text.
The pair also highlighted that creating a suite of content that was flexible was also a huge factor in what they were looking to build. “Business Analytics can be taught across a range of levels, and so the text we were looking to pull together was something that can provide that balance.”
Challenge: Materials don’t focus on building the skills needed for success in the workforce
It’s a common debate: are universities providing their students with the skills they need for their future employment?
For the Business Analytics author team, it was one they were adamant they wanted to get right.
From the embryonic concept of the book, they folded in the views of companies they wanted their students to be working in, past graduation. Explained Leida, “We’re based in California and we’re fortunate to have close ties with companies in the Silicon Valley, so we approached them before we started writing to establish exactly what they thought we should be teaching, what core topics and subjects we should be covering, and what skills we should focus on.”
In addition to the feedback from employers, the authors highlighted that they were keen to ensure an experiential experience for their learners. They’ve looked to achieve this through the frequent use of cases and big data that are folded throughout the text.
When it came to utilising big data, the author team explained how they fold in a large, public data set provided by the University of Chicago which includes thousands of rows of household data from the US alongside purchasing patterns and demographic data. The data is ‘messy’ which is similar to the kind of data students would receive in part of their roles past graduating. By using this large data set, the author team are looking to impress in their students the importance of being able to summarise the data and establish any issues around data quality. They are also building crucial skills students need in their future job roles and bolstering their understanding of the sort of work they would be undertaking in the workforce.
The authors also explained how Business Analytics students need to be able to wear a number of hats in their careers: the “technical” hat and the “non-technical, storytelling” hat. They believe that students need to understand the interplay between these two areas. Kevin shared that, in his experience, the storytelling hat can be “intimidating” for those students with a technical background but it’s a crucial skill needed for success in the workforce. Kevin explained, “Whenever we talk to industry partners and companies, they always impress upon us the importance of storytelling and communication and not just performing the analysis.”
To ensure that students learn how to grow their communication style and skills, the author team structured the book with this in mind. Shared Kevin, “Each chapter opens with an opening case that will contain a specific data set, and then in the chapter, there’s an explanation of how to solve that case. At the end, we show the students how to present the results.”
Another key skill needed in the workforce is the capacity to work independently. The textbook also contains detailed software instructions to enable students can work autonomously without relying on support from their instructors.
Lastly, there’s a big focus in the materials on data wrangling. The authors explained how data wrangling is a core area in Business Analytics. It, therefore, has a substantial amount of content devoted to it. Explained Kevin, “Some data scientists may spend up to 80% of their roles on data wrangling so a chapter is included that looks at key concepts, data inspection, binning, subsetting, and treatment of missing values and outliers. Transformation of numeric variables and categorical variables are also covered.”
“We hear a lot that this chapter is very useful for students to learn,” said Kevin.
Challenge: A new area doesn’t necessarily have a clear framework
The author team have, in their words, “infused” the industry-accepted CRISP-DM framework within their book to help learners navigate complex Business Analytics projects. It’s a six-phase learning model. The authors then overlaid learning outcomes for each of these six phases, as demonstrated by the table below. 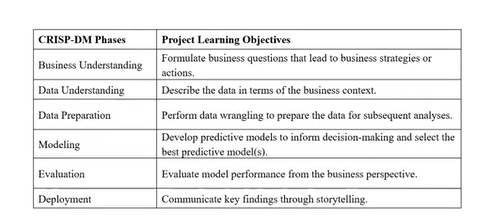
The CRISP-DM framework that the Business Analytics books lean on has been really valuable in enhancing student knowledge and memory retention and affords a synergy between the text and the industry which is important.
Challenge: Digital and Print functionality to enable unique teaching approaches
Having a mixture of print and digital resources gives educators the autonomy to pick and choose content, so they can enhance their own unique teaching styles.
The author team of Business Analytics was cognisant of this when considering their course offering. Kevin shared that the team “put a great deal of thought” into the digital provision complementing the title.
Highlighting some of the features they use a lot in their teaching, Kevin shared that the algorithmic questions were of great benefit. “If you have 50-60 students,” he said, “With algorithmic questions you know they won’t all get the same questions; they can’t be getting the answers from each other.” This has really helped him.
Kevin also shared that the homework assignments that can be set up in Connect are hugely time efficient. “They take minutes to set up and you are given so many options: you can set time limits, you can adjust the scoring, you can let them have multiple attempts, and so on. There is so much flexibility. And then, at the click of a button, I can grab a report to see how the students are getting on,” he said. He added that the auto-grading functionality in Connect is also very useful when it comes to being efficient with time.
This content was extracted from the webinar - New Techniques in Teaching Business Analytics, conducted by the authors, Kevin Lertwachara and Leida Chen. To watch the full webinar, please click here
About the authors of Business Analytics
Sanjiv Jaggia is a Professor of Economics and Finance at California Polytechnic State University, San Luis Obispo, United States.
Alison Kelly is a Professor of Economics at Suffolk University, United States.
Kevin Lertwachara is a Professor of Information Systems at California Polytechnic State University, San Luis Obispo, United States.
Leida Chen is a Professor of Information Systems at California Polytechnic State University, San Luis Obispo, United States.
About Business Analytics
The 2nd edition of Business Analytics is coming soon. It is made on the back of a hugely positive reaction to the 1st edition and has been built in line with extensive feedback from both faculty and students who utilised the first edition. Popular topics from the first edition such as data wrangling, data visualization (including new coverage on Tableau), and logistic regression, have been expanded, amongst others. New and in-depth content on prescriptive analytics (i.e. spreadsheet modeling, simulation, and optimization) are provided in four brand new chapters. Recent large data sets related to the COVID-19 pandemic are now also featured in the text in the form of exercise problems and cases. For more information about the 2nd edition, please click here.